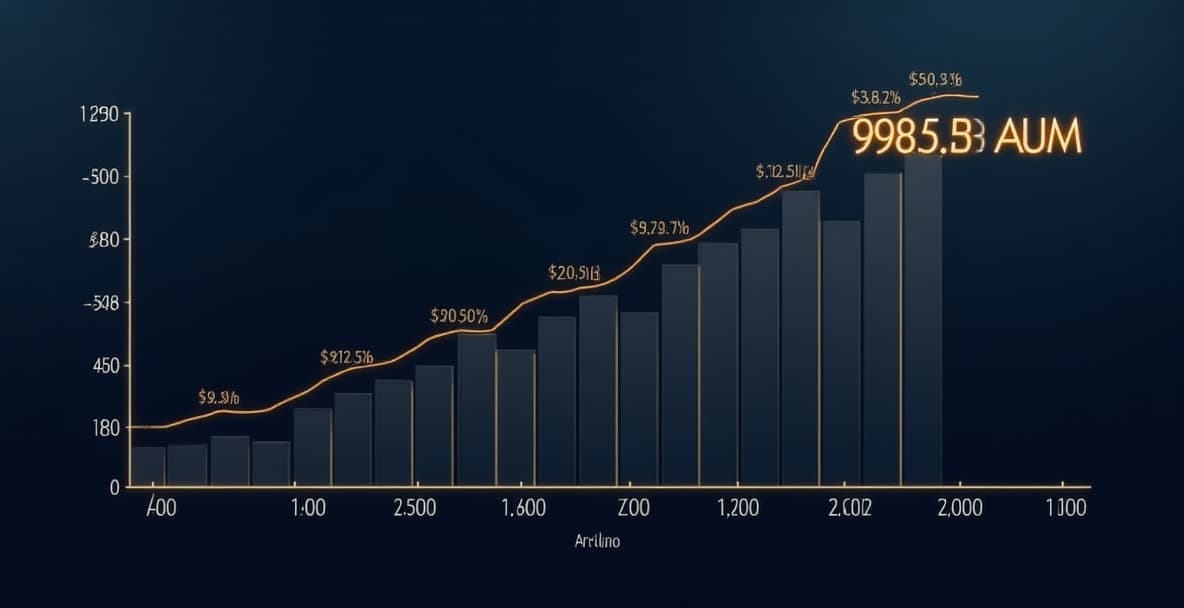
Vanguard S&P 500 ETF (VOO) breaks $995 billion in assets under management
This article was created with the help of artificial intelligence.
Key Takeaways
- Vanguard S&P 500 ETF (VOO) managed $995.5 billion in assets as of June 2026
- The expense ratio is 0.03 percent – the lowest available ratio for an S&P 500 ETF
- The one-year return as of June 26, 2026 was 29.74 percent, with the 10-year return at 15.61 percent annually
- The ETF replicates the S&P 500 Index by investing in all or virtually all index components in the same proportion as their index weighting
- The dividend yield was 1.10 percent (as of April 2026), with a distribution of $7.35 per share in the prior year
Vanguard S&P 500 ETF (VOO) managed $995.5 billion in assets as of June 2026, making it one of the largest exchange-traded funds globally. In May 2026, assets under management (AUM) stood at more than $950 billion – the increase demonstrates sustained demand for cost-effective index funds tracking the US benchmark index.
Expense ratio of 0.03 percent as competitive advantage
The VOO has an annual expense ratio of 0.03 percent – the lowest available ratio for an S&P 500 ETF. This puts it well below its direct competitor SPDR S&P 500 ETF Trust (SPY), which charges an expense ratio of 0.0945 percent. Only iShares Core S&P 500 ETF (IVV) offers the identical cost rate of 0.03 percent. An ETF is an exchange-traded index fund that trades on stock exchanges like a stock and replicates the performance of an underlying index.
The expense ratio indicates what percentage of assets under management is charged annually for fund administration and operation. For a $10,000 investment in VOO, annual costs amount to just $3.
Replication strategy and tax efficiency
The VOO follows a full replication strategy: it invests all or virtually all assets in the stocks of the S&P 500 Index, with each stock held at approximately the same weighting as in the index. This strategy enables precise tracking of index performance.
According to ETF.com (published June 9, 2026), the fund uses an open-end fund structure that avoids dividend drag and provides excellent tax efficiency. Dividend drag refers to the effect where dividends held without interest between distribution and reinvestment can reduce returns.
Performance overview as of June 26, 2026
VOO's return performance consistently exceeded the "Large Blend" category (large-cap US stocks with balanced growth and valuation structure). Performance data from June 26, 2026 show the following annualized returns:
- 1 month: 5.26 percent
- 3 months: 10.51 percent
- Year-to-date (YTD): 8.04 percent (Vanguard Advisors), alternative calculation 11.25 percent (Yahoo Finance)
- 1 year: 29.74 percent
- 3 years: 23.57 percent annually
- 5 years: 14.11 percent annually
- 10 years: 15.61 percent annually
Variances in YTD returns between different data providers result from different calculation methods and data collection times.
Dividend distribution and income profile
The VOO generated a dividend yield of 1.10 percent (as of April 13, 2026). Over the preceding year, the fund paid $7.35 per share in dividends. Dividends stem from distributions of companies included in the S&P 500 and are passed on to investors quarterly.
Suitability for long-term focused portfolios
According to ETF.com (June 9, 2026), VOO is particularly suitable for long-term oriented buy-and-hold investors. The combination of massive fund size, low costs, and focus on the S&P 500 Index has made VOO one of the most popular ETFs. The fund can serve as the core of a broadly diversified portfolio, as it covers 500 of the largest US companies.
The VOO is classified in the Morningstar "Large Blend" category and is characterized as non-diversified, since it invests all assets in S&P 500 components and thus concentrates exclusively on the US market. For geographic diversification, investors would need to add ETFs tracking international indices.