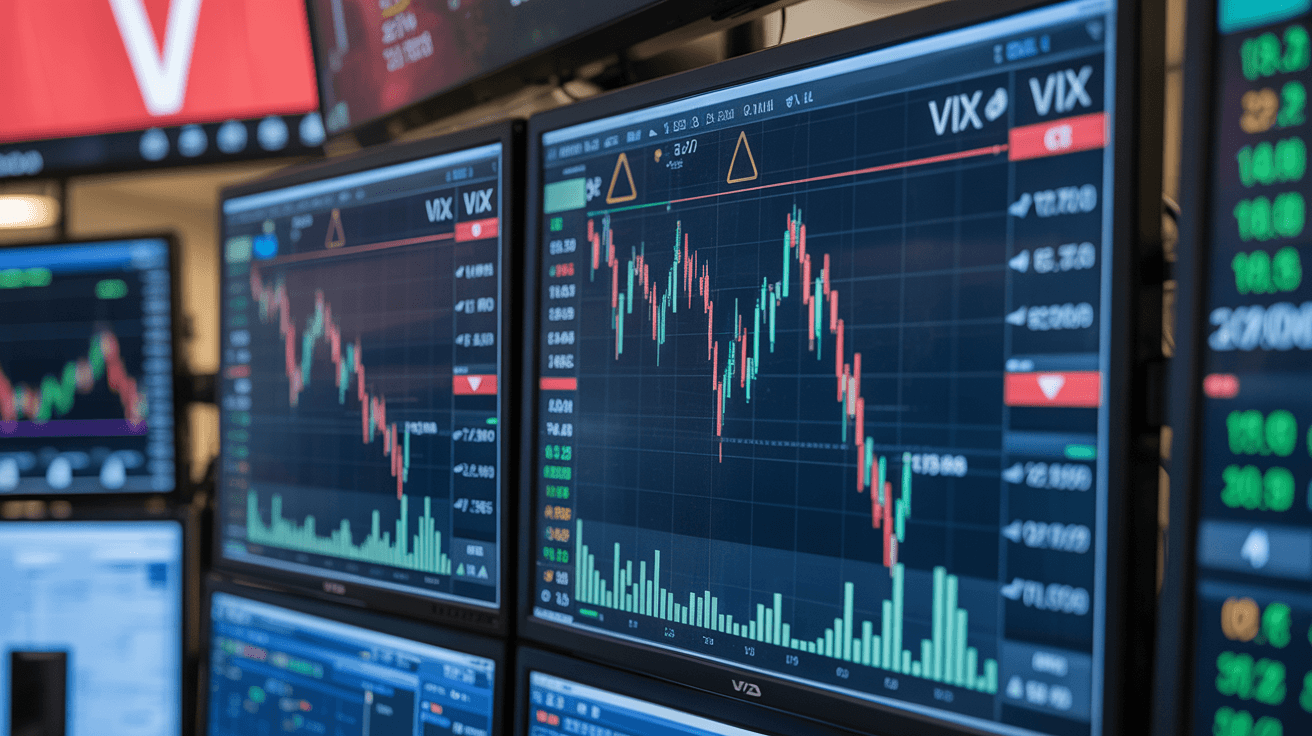
Nine Warning Signals Point to Bear Market – VIX Remains Surprisingly Calm
This article was created with the help of artificial intelligence.
Key Takeaways
- Nine indicators point in parallel to a changed market situation and signal a more comprehensive shift in market regime.
- The VIX only shows expected price swings, not the direction of future price movements; readings above 30 signal heightened uncertainty.
- The VIX futures curve typically is in contango – an upward-sloping structure that prevails 84 percent of the time and reflects calm markets.
- Historically, larger corrections have often come as surprises, especially when volatility measures signaled the all-clear.
- Bear markets are characterized by negative fundamental developments, euphoric investor sentiment, and significant negative catalysts.
A recent analysis warns of nine simultaneous signals that point to a possible bear market phase. Notably, the VIX volatility index, often referred to as the stock market's "fear gauge," is not currently reflecting these warning signs – a discrepancy that investors should monitor closely.
Multiple warning signals converge
The analysis published on Seeking Alpha identifies nine indicators that are pointing in parallel to a changed market situation. Unlike isolated risks within individual stock segments, these signals point to a more comprehensive shift in market regime. This affects multiple asset classes simultaneously – a pattern that has historically often been a precursor to larger corrections.
Fisher Investments, an established research house, emphasizes in its publications that bear markets can be identified through thorough analysis. Characteristic features include negative fundamental developments, euphoric investor sentiment, and the presence of significant negative catalysts. However, the institute acknowledges that nobody – themselves included – has correctly identified every bear market in advance.
The VIX anomaly explained
The VIX Index (Volatility Index) measures expected short-term volatility based on option prices on stock indices. As a rule of thumb: readings above 30 signal heightened uncertainty and market fear, while readings below 20 indicate stability. Importantly, the VIX only shows expected price swings, not the direction of future price movements.
The current situation is therefore unusual because despite the identified warning signals, the VIX remains comparatively low. Typically, the VIX futures curve is in contango – an upward-sloping structure that prevails 84 percent of the time and reflects calm markets with uncertainty expected only later. An inverted curve (backwardation) would indicate acute crisis conditions.
Perspective for investors in the DACH region
The Vanguard Total Stock Market ETF (VTI) tracks the entire U.S. stock market and is frequently used as a reference for the overall market condition. For Swiss, German, and Austrian investors with exposure to U.S. markets or globally diversified portfolios, such analyses are relevant, even though they do not constitute a direct recommendation for action.
The discrepancy between classic volatility indicators and fundamental warning signals deserves attention. Historically, larger corrections have often come as surprises, especially when volatility measures signaled the all-clear. Morningstar recommends financial advisors monitor various recession indicators in parallel – a strategy that also makes sense for individual investors.
What remains crucial: no analytical method guarantees correct predictions. Diversification, a long-term investment horizon, and understanding one's own risk tolerance remain central pillars of sound investment strategy – regardless of short-term market signals.