MSCI World ETF: How the classic for global portfolios works
This article was created with the help of artificial intelligence.
Key Takeaways
- The MSCI World comprises approximately 1,283 companies from 23 developed countries and covers about 85 percent of market capitalization in developed markets.
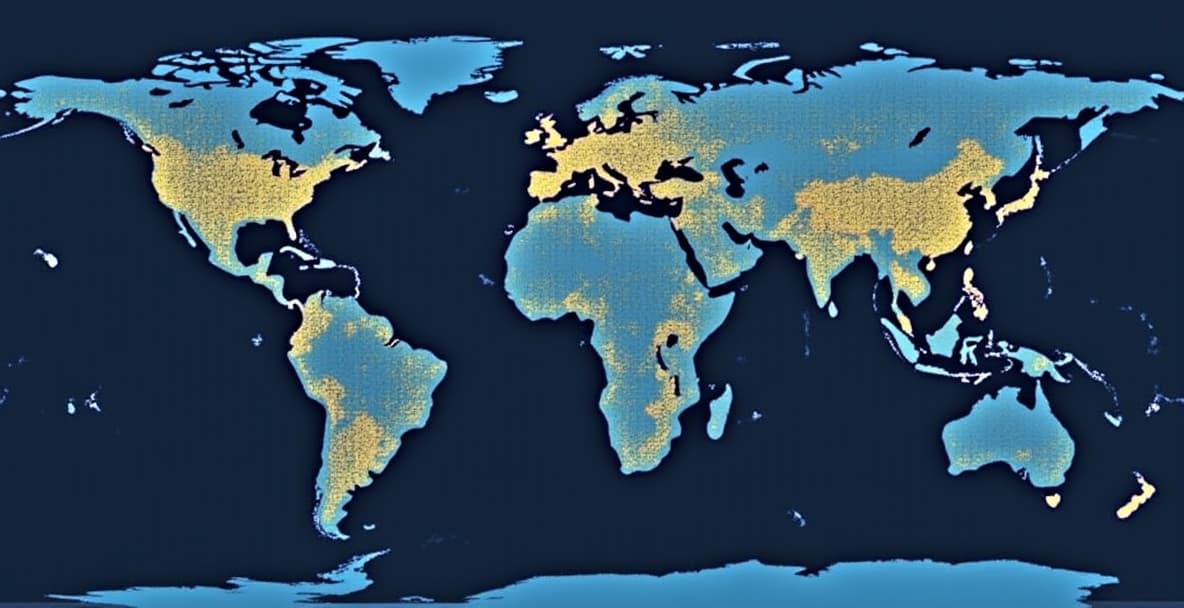
- The USA makes up a dominant 72.45 percent of the index, while emerging markets like China, India, and Brazil are completely absent.
- The average historical return from 1975 to 2024 was approximately 9.7 percent per year; over ten years (2014–2023), approximately 11.1 percent per year.
- Approximately 32 MSCI World ETFs are available in Europe with total expense ratios between 0.05 and 0.50 percent per year.
- The index is weighted by market capitalization and is adjusted quarterly, with MSCI announcing a major methodology reform for May 2026.
- Tech companies strongly shape the index: information technology makes up 30.27 percent, financial services 15.88 percent, and industrials 11.64 percent.
MSCI World ETF: How the classic for global portfolios works
An MSCI World ETF tracks an international stock index comprising the largest listed companies from 23 developed countries. With a single product, investors gain exposure to approximately 1,283 companies and participate in capital gains as well as dividends. The average historical return was around 9.7 percent per year, with costs ranging between 0.05 and 0.50 percent annually.
What is the MSCI World?
The MSCI World is a broadly diversified stock index that measures the performance of large and mid-cap companies from developed countries. It is calculated by US financial services company MSCI Inc. (Morgan Stanley Capital International). The index covers approximately 85 percent of market capitalization in developed markets.
The MSCI behind it
MSCI operates a variety of stock indices for different regions and themes. The provider sets the rules for which securities are included and continuously maintains the composition. As an index provider, MSCI earns license fees that ETF providers pay for replication.
Why the name is misleading
Despite the word World, the index contains no emerging markets. China, India, and Brazil are completely absent. Those who want to cover these growth markets turn to a global portfolio ETF based on a broader universe.
The MSCI World Index in the factsheet
A look at the hard numbers shows how the index is constructed. As of 30.06.2026, the following picture emerges:
- Companies in the index: approx. 1,283
- Developed countries: 23
- Market coverage: approximately 85 percent of market capitalization in developed countries
- Share of the ten largest holdings: 25.74 percent
The composition by sector
The sector distribution shows a clear overweight in technology. Information technology stands at 30.27 percent, financial services at 15.88 percent, industrials at 11.64 percent. This concentration significantly influences price performance.
The stock index as basis for ETFs
The stock index itself is not a tradable product. Only the ETF makes it investable. An exchange-traded fund purchases the constituent stocks and tracks the index's performance as closely as possible.
Which countries are in the MSCI World?
The country weighting is very unbalanced. The US clearly dominates the index, while European and Asian markets are significantly smaller.
- USA: 72.45 percent
- Japan: 5.69 percent
- United Kingdom: 3.45 percent
- Other 20 developed countries: the remainder
Understanding country concentration risk
The high US weighting means: if the American stock market collapses, the entire index follows suit. However, many US companies generate their revenues worldwide, which relativizes geographic dependence.
Which companies are in the MSCI World ETF?
Weighting is determined by market capitalization. Large companies automatically receive higher weighting than smaller ones. The largest current positions include Apple, Microsoft, Nvidia, Amazon, and Meta.
Amazon and the tech giants
Amazon exemplifies the dominance of technology-driven companies. Together with Microsoft and other heavyweights, just a few securities determine a substantial portion of returns. This increases opportunities in good years but amplifies losses during downturns.
How is the MSCI World calculated?
Index calculation follows free-float market capitalization. Each company is weighted by its freely traded market value. When a large company's share price rises, its weight in the index automatically increases.
The difference from a price index
In a price index, only price movements count. The more widely used performance index includes dividends and reflects returns in full. For calculating long-term returns, this variant is the meaningful basis.
Regular adjustments
Quarterly, MSCI reviews the composition. According to fixed criteria, securities are removed or added. For May 2026, the provider has announced a major methodology reform that could result in significant index rebalancing.
What variants of the MSCI World exist?
Alongside the standard index, several offshoots exist for specific investment strategies. They start with the same base universe and filter by additional criteria.
- MSCI World ESG Leaders: Selection by environmental and social criteria
- MSCI World SRI: stricter exclusions of controversial business segments
- MSCI World ex USA: without the US component to reduce concentration risk
MSCI ACWI and All Country
Those who want to combine developed and emerging markets in one product should look at the MSCI ACWI. The MSCI All Country World additionally covers emerging markets. This creates a more comprehensive portfolio with a single ETF.
Performance and MSCI World returns
MSCI World returns impress particularly over the long term. Over decades, the index has repeatedly recovered from setbacks. A brief overview of the key figures:
- Average 1975 to 2024: approx. 9.7 percent p.a. (net, Euro basis, Source: Finanztip)
- Ten years 2014 to 2023: approx. 11.1 percent p.a.
- One-year value of top ETFs as of 31.07.2026: approximately +19.5 percent
- Three-year value of top ETFs: approx. +58 percent cumulative
Returns over the long average
The iShares Core MSCI World ETF has achieved an average of around 12 percent per year since its launch in 2009 (Source: extraETF). Such returns do not occur linearly but through highs and lows. Past performance is no guarantee of future results.
Performance during the current year
As of 31.07.2026, the performance of the largest ETF was around +11.37 percent in euros. Such figures fluctuate significantly and are not suitable for forecasts. Those who look at performance over ten years see the true potential much more clearly.
Which MSCI World funds are the best?
Around 32 ETFs on the index are available in Europe, both distributing and accumulating. Differences lie in costs, fund size, and replication method. There is no universally best fund; the right choice depends on your investment objective.
Costs and total expense ratio
The total expense ratio (TER) ranges from 0.05 to 0.50 percent per year. Cheap products are at 0.05 percent, while established funds are often significantly more expensive. With an identical index, a high TER noticeably eats into returns.
Fund size and providers
The largest MSCI World ETF manages approximately 123 billion euros in assets and ranks among the world's largest funds. High volume ensures liquidity at home exchanges and tighter bid-ask spreads. Most funds are domiciled in Ireland, some in Luxembourg, France, or Germany.
Stiftung Warentest ratings
Stiftung Warentest has rated broadly diversified world indices as solid base investments for years. The low total expense ratio and broad diversification make the MSCI World a frequently recommended building block for wealth accumulation.
Replication and distributions: the details
Two technical features determine how an ETF operates: replication and dividend treatment.
Physical and synthetic replication
With physical replication, the fund actually purchases the stocks, either in full or through optimized sampling. Synthetic replication replicates performance through swap agreements. The latter can offer tax benefits but carries counterparty risk.
Accumulating or distributing
Accumulating ETFs automatically reinvest dividends and benefit from the compounding effect. Distributing variants pay out returns regularly. Those seeking regular distributions choose the distributing version; those building wealth often choose the accumulating version.
How to invest in the MSCI World
Getting started is simple through a brokerage or bank account. After opening an account, you search for the suitable ETF using its security identification number and buy it like a stock. For regular wealth building, a savings plan is the most popular tool.
Invest regularly with an MSCI World ETF savings plan
An ETF savings plan automatically invests fixed amounts, often starting from just one euro monthly. The cost-averaging effect smooths entry prices and eliminates the need for market timing. This way, investors gradually build wealth without monitoring the market.
Compare brokers and terms
The availability of a savings plan is determined by each broker, not the fund provider. Many accounts come without custody fees; numerous savings plan offerings are free. Providers like finanzen.net ZERO enable low-cost trading, operated by finanzen.net zero GmbH.
Is the MSCI World ETF still worthwhile?
For long-term wealth building, the MSCI World remains a sensible building block. A time horizon of at least ten to fifteen years is important. Short-term fluctuations are inevitable and should be weathered.
The main risks
Besides US concentration risk and technology sector concentration, geopolitical tensions and trade conflicts burden certain sectors. These risks can be mitigated through broad diversification but cannot be eliminated entirely. A thoughtful investment decision considers both sides.
Sensible supplements
To balance US overweight, many investors combine the MSCI World with additional ETFs:
- MSCI Emerging Markets for emerging markets, for example in a 70/30 allocation
- Small-cap funds for smaller companies outside the standard index
- MSCI ACWI or an FTSE All-World as a single solution
Where will the MSCI World stand in ten years?
Serious forecasts about individual share prices are impossible. Historically, the index has delivered positive returns over periods of ten years almost always. Those who watch price performance see distinct swings both up and down.
What history shows
The long-term price performance of the global stock market trended upward despite crises. Precisely therein lies the strength of broad diversification: weaknesses in individual countries or sectors are offset by other regions. This resilience makes the index attractive for investing.
Practical tips for your investment
Those investing in an MSCI World ETF should keep several points in mind. They facilitate the selection and protect against typical mistakes.
- Pay attention to a low total expense ratio, as it reduces returns permanently
- Check replication method and fund size
- Consciously decide between accumulating and distributing
- Use a savings plan and stick with it rigidly
Keep finances and investing in view
Thorough analyses and current news around stocks, ETFs, and the stock market help with every investment decision. Those who plan their finances long-term benefit from a clear investment approach rather than hectic buying. The MSCI World provides a broad, cost-effective foundation for that.
Transparency on affiliate links
Some broker referrals are affiliate links. This creates no additional costs for readers, and the editorial selection remains unaffected. Detailed information on derivatives and other topics is offered in the guide to derivatives.